
By Watson Scott Swail, President & Senior Research Scholar, Educational Policy Institute
There is much talk about increasing college access and success for students in the United States, especially for those populations who are historically underrepresented in higher education, such as low-income, first generation, and minority students. While access rates have increased over the years, we clearly understand that equity has not been achieved and that large gaps remain between the haves—White and Asian populations—and Black, Hispanic, and other minority groups. We have done much to move the equity issue forward, but let’s be clear: we have far, far to go to achieve this dream.

For over 50 years, federal and state policy has focused primarily on college access to higher education.[i] Landmark legislation, such as the Civil Rights Act of 1964 and the Higher Education Act of 1965, propelled the access principle for higher education in an attempt to level the playing field. Since those early years, and with many other legislative and programmatic efforts (e.g., Pell Grant, federal loan programs, Headstart, TRIO and GEAR UP), access for all students has increased, especially those from low-income, first-generation, and minority backgrounds. However, while college matriculation rates have increased and the gaps between ethnic and other groups have lessened, equity is far from apparent. For instance, Black and Hispanic students still:
- graduate from high school at rates 10-15 percent lower than White students, as do low-income students;[ii]
- remain far less prepared for college than White students;[iii]
- matriculate to college at lower rates.[iv] and
- enroll at selective institutions at lower rates than White, Asian, and affluent students.
The following exhibit illustrates the challenges that still face students of color, which are mirrored (but not illustrated herein) for low-income and first-generation students. As illustrated, more White students attend four-year institutions compared to Black and Hispanic students, including private, not-for-profit institutions. Conversely, almost half of all Hispanic students that enter college begin at a two-year institution, compared to only one third of White students. It isn’t always whether students go to college; rather, it does matter where they enroll and attend.
Exhibit 1. Total distribution of fall undergraduate enrollment in degree-granting postsecondary education institutions, by institution type and race/ethnicity, 2016
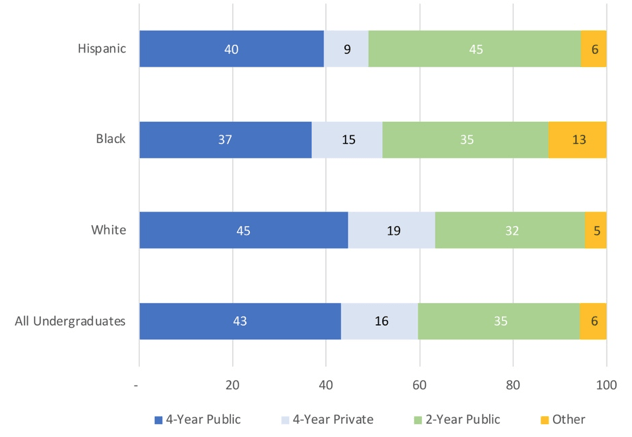
SOURCE: U.S. Department of Education, National Center for Education Statistics, Integrated Postsecondary Education Data System (IPEDS), Spring 2017, Fall Enrollment component.
Once students do get to college, the barriers only seem to get taller. According to data from the National Center for Education Statistics (NCES) and analyzed by researchers at RTI, 60 percent of full-time, first-time, degree-seeking students who began their studies in 2008 at a four-year institution graduated with a bachelor’s degree within six years.[v] The graphic below illustrates two important points. The first is that the completion rates of historically-underrepresented students in our colleges and universities is much lower rates than White and Asian students. Comparatively, 71 percent of Asians and 63 percent of White students earned a BA within six years, while 54 percent of Hispanic students, 50 percent of native Hawaiian/Pacific Islander students, 41 percent of American Indian/Alaskan Natives, and 41 percent of Black students earned a BA within that time period. The gap between White and Black students remains about 22 percent.
The graphic also depicts completion by gender. In every category, women outpace men in graduation rates by between 0.2 and 9.5 percent. The largest gender gaps exist within the Hispanic and Black groups, and the lowest being within Native Hawaiian/Pacific Islanders.
Exhibit 2. Six-year graduation rates of bachelor’s degree seeking students attending four-year institutions, by race/ethnicity, and gender, 2008-2014

SOURCE: U.S. Department of Education, National Center for Education Statistics, https://nces.ed.gov/pubs2015/2015181.pdf. Graphic and data analysis by the Educational Policy Institute.
Another challenge, and perception issue in higher education, is the timing of when students dropout from college. The predominant thought in higher education is that most students stopout or dropout of college during or immediately after the first year. However, data illustrates that this is typically not the case. The exhibit below shows that students who started at a public four-year institution in fall 2003 dropped out over a long period of time.[vi] In total, 65 percent of students who began their studies at a four-year public institution earned a degree within six years. At the end of six years, 13 percent of students were still enrolled. Thus, 22 percent of students left without earning a degree of any type. As illustrated, most students who dropped out left after the start of their third year (16 percent). Three percent left in each of the first two years, 5 percent in the third year, and 11 percent during or after the fourth year.
Exhibit 3. Departure rates and times for all first-time, full-time undergraduate students who began their studies at a four-year institution, 2004-2009

SOURCE: U.S. Department of Education, National Center for Education Statistics, Beginning Postsecondary Student (BPS: 04/09). Graphic and data analysis by the Educational Policy Institute.
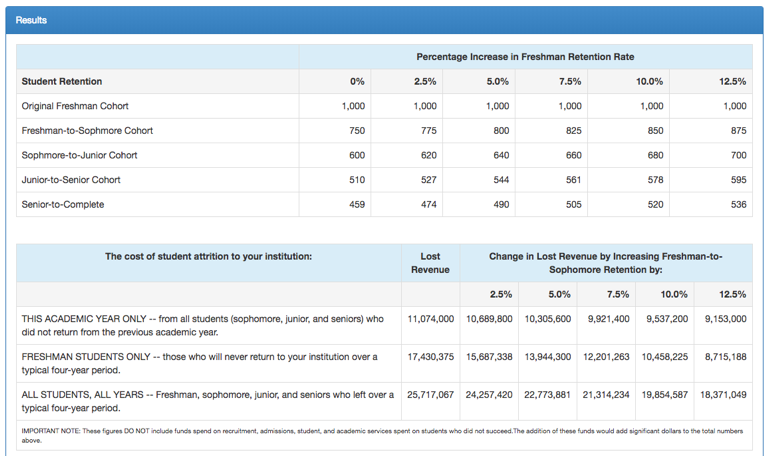
Several years ago, EPI built the EPI Retention Calculator to determine approximate cost of losing students to attrition. Even for the smallest institutions, the valuation runs into seven digits very quickly. For larger institutions, tens of millions of dollars are lost on students that enroll and disappear. In the end, college is not the best of business models, with the exception of institutions that simply play the shark-tooth model of enrollment: for every student they lose, they simply replace them with someone else. To be fair and accurate, institutions of higher education, on average, enroll approximately 140 percent of their desired freshman class due to their accepted attrition numbers.
The test analysis below using the EPI Retention Calculator illustrates the cost for a small, four-year institution that enrolls 1,000 freshman students each fall. Given the assumptions made below, the outcomes are as follows: the cost of losing students in one academic year exceeds $11 million. Over a four-year period, that amount increases to $25 million. This example is for a small institution. For medium and larger institutions, the numbers are dramatic.
Exhibit 4. Cost of student departure for fictitious institution using EPI Retention Calculator.


If we truly want to increase equity in college access and success, we have to focus on three critical issues: academic preparation, college costs and financial aid, and academic structures.
ACADEMIC PREPARATION. Improving the academic preparation and college knowledge of students is paramount to increasing college access and success. Data clearly link college success with high school GPA, SAT/ACT scores, as well as other academic indicators of preparation. This is, by far, the greatest barrier to going to and succeeding in college, bar none. When students are not adequately academically and socially prepared for college, they simply do not apply nor attend. This is as much a “college knowledge” issue, drawing language from my friend and colleague David Conley, as anything else. Students need to understand college in order to prepare for it. If the notion of “college” remains out of a student’s lexicon, his or her chances of ever going to college are greatly diminished.
What do we do about it? It’s easy: improve our K12 system. Kidding aside, if we stopped stuffing so much content into the secondary curriculum and focus on less we would most certainly do more. We understand clearly that students who do not read do not perform, and reading is a skill that more affluent and White youth embrace at a young age than other students. The 2017 NAEP reading scores clearly illustrate that Black, Hispanic, Pacific Islanders, American Indians, and low-income students lag far behind in their reading skills than White and more affluent students.[vii] Over the past 25 years, the reading scores of fourth-grade students on NAEP have stayed almost level. While people like to focus on mathematics, which is undeniably important, reading and writing is the real gatekeeper to anything that matters in society. Teaching students these requisite skills and spending years honing it is the best way to preparation, but as the NAEP scores show, the damage is largely done by elementary school.
Secondly, teaching students about college and career is critical to proper preparation for post-high school life. Our youth need to know what the opportunities are in the workforce and what it takes to get there. Understanding what college is and what academic and financial preparation is required to get there is something we must ensure every child and family understands.
COLLEGE COSTS AND FINANCIAL AID. Increasing financial aid and controlling the cost of college are key pieces of keeping students in college. After academic preparation, the cost—or price—of college is the second primary reason students do not succeed in college. For low-income students, college costs have remained relatively stable once Pell grants and other need-based aid are added into the formula. Still, financial pressures on these students grow over time, resulting in a higher rate of departure beyond the first year of college. They hang on, but only for a while longer. Finance gets in the way of degree completion. Part of this issue is ensuring there is enough need-based aid available for students. The other is ensuring that colleges control their costs and reduce the annual inflationary pressures of tuition, fees, and room and board. If these costs continue to escalate the way they have over the past 30-plus years, no amount of financial aid will keep pace. Something has to give before the system blows up. The bubble is about ready to burst.
ACADEMIC AND DEGREE STRUCTURES. The current structure of higher education, especially the four-year experience, seems somewhat arcane in today’s society. However, we still cling to the four-year, 120 credit hour system like a life raft in a vast ocean full of sharks and predators. The system has surely evolved over the years, nonetheless the system seems very similar to that of the 1960s—50 years ago. I ask this question: does our society look a lot like the 1960s? Do the jobs and economy look the same? Do our people even look the same? As with society, higher education needs to progress, too. There is no real reason to have a four-year program if the same can be taught quicker. As a parent who has paid for three kids to go to college, I wasn’t enamored with stroking a tuition and fee check, plus room and board and books, to cover physical activity credits and other courses that were not either of interest or aligned to my sons’ degree programs. This isn’t to take away from a liberal arts or any other carefully articulated degree program. All programs should be carefully thought out and derived. There is an inordinate amount of waste in higher education that amounts as much to an institution’s historical inertia or culture of regression to the mean than anything else. We do it this way because that’s the way it has been done. Not a great business plan.
Some programs are now pushing for longer degree programs past four years at a time when we should be considering the reduction of years and credits to degree. I’m sure that we can come up with a 90-credit degree program that results in similar outcomes as current 120-credit programs. For professional degrees, they can require a master’s degree beyond the three-year degree to move forward. There are other ways to do this thing we call college.
As well, let us reduce the number of gatekeeper courses in non-degree related areas. Sure, faculty want to ensure that their students are “well rounded” in the various disciplines, but as I have opined many times before, an English major really doesn’t need another mathematics course. Did they complete their high school math requirement? If so, can’t we say they are done in the math field? It can be argued that less than 1 percent of society needs advanced calculus, or any calculus at all. As a statistician who completed over 30 undergraduate credits in mathematics, including number theory and other mindblowing courses, I can safely say that I probably used 10 percent of my college mathematics knowledge in the real world. Most of my statistical knowledge is based on understanding software, not math. Purists will recant on that, even though it is the truth. I learned the three Ms in middle school: Mean, Median, and Mode. Again, I do not suggest that mathematics and STEM is not important. Clearly, STEM is more important than ever in our society and economy. However, it is much less important for someone not entering a STEM career. Let us reduce gatekeepers that keep people from progressing and also reduce the time to degree for a bachelor’s and other degree programs.
These are solutions that are simply in print and much less simple in the real world. Regardless, we have to start somewhere. And we must start soon.
[i] Financial Aid is Not Enough (Gladieux, Swail, 1998).
[ii] http://nces.ed.gov/ccd/tables/ACGR_RE_and_characteristics_2013-14.asp
[iii] The Condition of College & Career Readiness 2016. ACT.
[iv] U.S. Department of Commerce, Census Bureau, Current Population Survey (CPS), October, 1970 through 2016. (Retrieved February 13, 2018 by EPI).
[v] http://educationalpolicy.org/publications/EPIGraph/171025_EPIGraph.html.
[vi] http://educationalpolicy.org/publications/EPIGraph/141029_EPIGraph.html.
