
By Dr. Watson Scott Swail, President & CEO, Educational Policy Institute
In 2013, state and federal governments spent approximately $150 billion on higher education. This includes funding for Pell Grants, state grants, research, and direct subsidies for students. To put this in some perspective, federal funding amounted to $227 per person in the US, and about double that if state funds are included. On the federal level, this accounts for 2 percent of the federal budget. By comparison, the US defense budget in 2013 was $610 billion, or 17.5 percent of the US budget. This isn’t to discount the value of $75 million in federal money. That amount is simply huge, but everything pales in comparison to the US Department of Defense budget.
Beyond state and federal funds, parents and students pay over $63 million annually on tuition and fee charges. This does not include student housing fees.
The point is simple: higher education is big business. There are currently over 27 million students attending 7,000+ Title IV institutions in the US.[1] With graduate rates for all Title IV institutions averaging 50 percent, and grad rates at four-year institutions about 10 points higher, there are a lot of students that fail to earn a degree. Students loose in opportunity cost and student debt; institutions loose by spending a lot of funds on students that do not complete and leave a lot of potential revenue on the table.
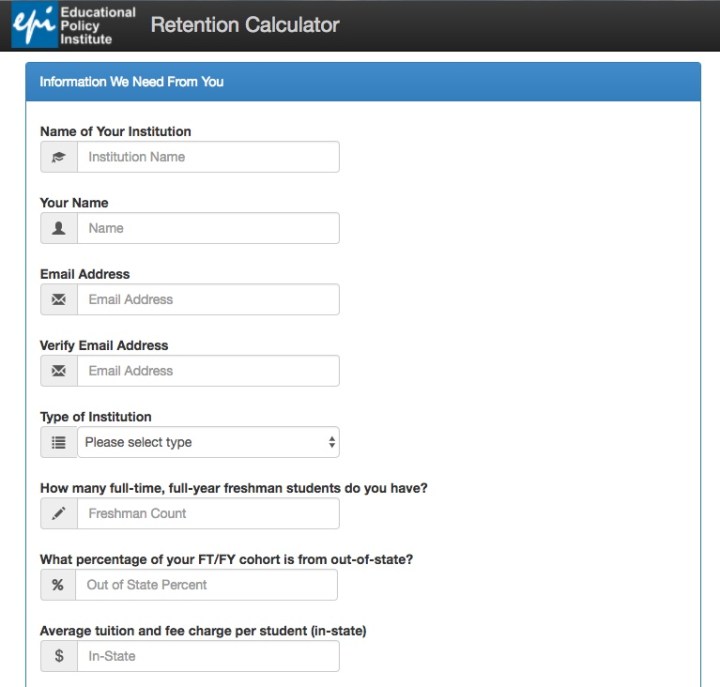
The Educational Policy Institute created the Retention Calculator to try and put a number to this issue. The calculator is free for use and we urge institutional administrators to use the calculator to help guide their student success initiatives and campus budgeting.
For today’s example, I am using Virginia Commonwealth University (VCU) in Richmond, Virginia, and Youngstown State University (YSU) in Youngstown, Ohio, both of which were picked for no particular purpose. The numbers used in the calculation were pulled from institutional documents, IPEDs, the College Board, and other sources. I had to generate some numbers based on others. Understand that although I believe this is by far the best cost calculator available, it is still not a perfect science because of the various imperfections of higher education data and the sheer complication of cost and price. But it provides a legitimate record of cost for the university.
VIRGINIA COMMONWEALTH UNIVERSITY (VCU)
Basic Input:
- VCU has approximately 31,000 students, of whom 24,000 are undergraduates, of which 2,000 are incoming transfers.
- Based on a 34 percent enrollment rate from new admits, VCU has approximately 5,000 freshman students.
- Eleven percent of VCU students are from out of state, paying a tuition fee of $31,464.
- In state tuition is $12,772.
- Over the past several years, tuition and fee charges have increased, on average, 10 percent per year.
- $7,600 in state subsidy per students. This is only a national average provided by the College Board. Certainly these numbers vary greatly by institution and state.
- The fall-to-fall freshman retention rate at VCU is 86 percent.
- The six-year graduation rate is 62 percent.
Given this scenario, the 5,000 freshman students at VCU will translate into approximately 3,100 graduates within six years. Based on the output from the EPI Retention Calculator, here are the findings:
- VCU will lose 700 of their freshman students by the start of the sophomore year, leaving 4,300 of the original cohort. That cohort will drop to 3,135 students by year six (62 percent graduation rate).
- The cost of losing students at the current rate is $36 million in this academic year.
- The cost associated with losing only the students from the freshman cohort climbs to $54 million over a four-year period.
- The cost associated with losing all students during these six years is $86 million.
Let us be real for a moment: there is no way that any institution can retain all students over a six-year period, unless your name is Harvard, which has a 98 percent fall-to-fall retention rate and, get this, a 98 percent six-year graduation rate, meaning that after the first year, Harvard doesn’t lose anyone. That is truly unbelievable. Yale is hardly outdone with a 99 percent fall-to-fall rate and 97 percent six-year graduation rate. Within Virginia, the University of Virginia has a 97 percent fall-to-fall rate and 93 percent six-year graduation rate.
The Ivy Leagues and other very selective institutions are outstanding and tell us two things: (1) these are among the most selective institutions in the world; and (2) they do prudence with respect to student support services to students on campus. The moderately selective and non-selective universities are in a difficult boat, however. Their incoming students are more diverse, academically and otherwise, with entering student SATs of 900 to 1200 rather than 1500 and above. This makes all the difference in the world in terms of retaining students. However, one rule applies to all universities regardless of whom they admit: promise to do whatever possible to help students succeed.
If institutions dedicate themselves to improving student and academic services to enhance the student experience, they can increase the percentage of students returning after freshman, sophomore, and junior years and, in turn, increase the four- and six-year graduation rates at their institutions.
Here is the dollar value of improving the fall-to-fall rate at VCU:
- If VCU increased its freshman-to-sophomore rates 2.5 percent, they would save $2.5 million in this academic year and up to $10 million across a four-year period.
- If they increase that rate to five percent, the current year savings are $4.9 million and four-year rates approximately $19 million.
YOUNGSTOWN STATE UNIVERSITY (YSU)
Basic Input:
- YSU has approximately 12,400 students, of whom 11,100 are undergraduates, of which 500 are incoming transfers.
- Based on a 36 percent enrollment rate from new admits, YSU has approximately 2,868 freshman students.
- 13 percent of YSU students are from out of state, paying a tuition fee of $8,557, not much different than the instate mark of $8,317.
- Tuition and fee charges have increased less than one percent over the last several years.
- $7,600 in state subsidy per student, which is a national average provided by the College Board. These data vary greatly by institution and state so these are a filler.
- The fall-to-fall freshman retention rate at YSU is 86 percent.
- The six-year graduation rate is 30 percent.
Given this scenario, the 2,868 freshman students at YSU will translate into approximately 866 graduates within six years. Based on the output from the EPI Retention Calculator, here are the findings:
- YSU will lose 700 of their freshman students by the start of the sophomore year, leaving 2,151 of their original cohort. That cohort will drop to 847 (approx.) by year six (30 percent graduation rate).
- The cost of losing students at the current rate is $28 million in this academic year.
- The cost associated with losing only the students from the freshman cohort climbs to $35 million over a four-year period.
- The cost associated with losing all students during these four years is $60 million.
As said with the VCU example, YSU cannot retain all students over a six-year period. But they can do better and the money saved would easily pay for whatever efforts they spend, as long as they can front load the effort.
- If YSU increased its freshman-to-sophomore rates 2.5 percent, they would save $609,000 in this academic year and up to $3.5 million across a four-year period.
- If they increase that rate to five percent, the current year savings are $1.2 million and four-year rates approximately $7 million.
* * * * *
These calculations are highly conservative. They do not include the cost to institutions for inflated staffing and infrastructure for recruiting and admitting 150 percent of their expended student body. Institutions understand that they will hemorrhage students, so they build it into their staffing model. If institutions could be more effective in (a) recruiting better-fit students who have a higher propensity of success, and (b) do more with the students while under their care, then institutions could hire accordingly and spend accordingly. Instead of working at a 150-percent model, they could perhaps work at a 120- or 110-percent model. Harvard works on a 102-percent model. Pretty cool.
New EPI Retention Calculator Record
Date Time: 11/28/2016 2:30:31 PM UTC
| Field | Value |
| Institution Name | Virginia Commonwealth University |
| 2-4 Year | 4 Year |
| Full Time Freshmen | 5000 |
| Out of state Percent | 11% |
| In-State Cost | 12772 |
| Out-of-State Cost | 31464 |
| Annual Fee Increase | 10% |
| Subsidy | 7600 |
| Year1 return for Year2 | 86% |
| Year2 return for Year3 | 90% |
| Year3 return for Year4 | 90% |
| Year4 completed | 90% |
Results
| Percentage Increase in Freshman Retention Rate | ||||||
| Student Retention | 0 % | 2.5 % | 5.0 % | 7.5 % | 10.0 % | 12.5 % |
| Original Freshman Cohort | 5,000 | 5,000 | 5,000 | 5,000 | 5,000 | 5,000 |
| Freshman-to-Sophmore Cohort | 4,300 | 4,425 | 4,550 | 4,675 | 4,800 | 4,925 |
| Sophmore-to-Junior Cohort | 3,870 | 3,982 | 4,095 | 4,208 | 4,320 | 4,432 |
| Junior-to-Senior Cohort | 3,483 | 3,584 | 3,686 | 3,787 | 3,888 | 3,989 |
| Senior-to-Complete | 3,135 | 3,226 | 3,317 | 3,408 | 3,499 | 3,590 |
| The cost of student attrition to your institution: | Lost Revenue | Change in Lost Revenue by Increasing Freshman-to-Sophomore Retention by: | ||||
| 2.5% | 5.0% | 7.5% | 10.0% | 12.5% | ||
| THIS ACADEMIC YEAR ONLY — from all students (sophomore, junior, and seniors) who did not return from the previous academic year. | 36,272,884 | 33,857,880 | 31,418,965 | 29,003,961 | 26,588,956 | 24,173,952 |
| FRESHMAN STUDENTS ONLY — those who will never return to your institution over a typical four-year period. | 53,752,429 | 44,153,781 | 34,555,133 | 24,956,485 | 15,357,837 | 5,759,189 |
| ALL STUDENTS, ALL YEARS — Freshman, sophomore, junior, and seniors who left over a typical four-year period. | 86,003,085 | 77,365,217 | 68,701,806 | 60,011,060 | 51,373,191 | 42,735,322 |
| Change in Revenue by Increasing the Freshman-to-Sophomore Retention rate by: | |||||
| 2.5% | 5.0% | 7.5% | 10.0% | 12.5% | |
| THIS ACADEMIC YEAR ONLY — from all students (sophomore, junior, and seniors) who did not return from the previous academic year. | 2,415,004 | 4,853,919 | 7,268,923 | 9,683,927 | 12,098,932 |
| FRESHMAN STUDENTS ONLY — those who will never return to your institution over a typical four-year period. | 9,598,648 | 19,197,296 | 28,795,944 | 38,394,592 | 47,993,241 |
| ALL STUDENTS, ALL YEARS — Freshman, sophomore, junior, and seniors who left over a typical four-year period. | 8,637,869 | 17,301,279 | 25,992,026 | 34,629,894 | 43,267,763 |
New EPI Retention Calculator Record
Date Time: 11/28/2016 5:18:19 PM UTC
| Field | Value |
| Institution Name | Youngstown State University |
| 2-4 Year | 4 Year |
| Full Time Freshmen | 2868 |
| Out of state Percent | 13% |
| In-State Cost | 8317 |
| Out-of-State Cost | 8557 |
| Annual Fee Increase | 1% |
| Subsidy | 7600 |
| Year1 return for Year2 | 75% |
| Year2 return for Year3 | 75% |
| Year3 return for Year4 | 80% |
| Year4 completed | 80% |
Results
| Percentage Increase in Freshman Retention Rate | ||||||
| Student Retention | 0 % | 2.5 % | 5.0 % | 7.5 % | 10.0 % | 12.5 % |
| Original Freshman Cohort | 2,868 | 2,868 | 2,868 | 2,868 | 2,868 | 2,868 |
| Freshman-to-Sophmore Cohort | 2,151 | 2,223 | 2,294 | 2,366 | 2,438 | 2,510 |
| Sophmore-to-Junior Cohort | 1,613 | 1,667 | 1,721 | 1,775 | 1,828 | 1,882 |
| Junior-to-Senior Cohort | 1,291 | 1,334 | 1,377 | 1,420 | 1,463 | 1,506 |
| Senior-to-Complete | 1,032 | 1,067 | 1,101 | 1,136 | 1,170 | 1,205 |
| The cost of student attrition to your institution: | Lost Revenue | Change in Lost Revenue by Increasing Freshman-to-Sophomore Retention by: | ||||
| 2.5% | 5.0% | 7.5% | 10.0% | 12.5% | ||
| THIS ACADEMIC YEAR ONLY — from all students (sophomore, junior, and seniors) who did not return from the previous academic year. | 25,281,963 | 24,592,600 | 23,903,238 | 23,213,876 | 22,524,513 | 21,835,151 |
| FRESHMAN STUDENTS ONLY — those who will never return to your institution over a typical four-year period. | 34,666,118 | 31,185,002 | 27,752,234 | 24,271,117 | 20,790,001 | 17,308,885 |
| ALL STUDENTS, ALL YEARS — Freshman, sophomore, junior, and seniors who left over a typical four-year period. | 56,248,849 | 53,479,051 | 50,741,485 | 47,971,687 | 45,250,407 | 42,480,608 |
| Change in Revenue by Increasing the Freshman-to-Sophomore Retention rate by: | |||||
| 2.5% | 5.0% | 7.5% | 10.0% | 12.5% | |
| THIS ACADEMIC YEAR ONLY — from all students (sophomore, junior, and seniors) who did not return from the previous academic year. | 689,362 | 1,378,725 | 2,068,087 | 2,757,449 | 3,446,812 |
| FRESHMAN STUDENTS ONLY — those who will never return to your institution over a typical four-year period. | 3,481,116 | 6,913,884 | 10,395,001 | 13,876,117 | 17,357,233 |
| ALL STUDENTS, ALL YEARS — Freshman, sophomore, junior, and seniors who left over a typical four-year period. | 2,769,798 | 5,507,364 | 8,277,162 | 10,998,442 | 13,768,241 |
[1] Title IV institutions are those that are approved and accredited to provide federal financial aid to students. The 27 million number is unduplicated students. See http://nces.ed.gov/pubs2016/2016112rev.pdf.

Nice blog thankks for posting